Perf Without Programming

无编程 perf

perf 是快速定位问题的利器,由于缺乏系统的理解,笔者在工作中未能用好 perf 。

这篇文章会由概述至细节地探讨 perf 、探讨 perf 与 kprobe / uprobe ... 之间的关系,介绍无编程情况下如何使用 perf 定位问题,若有错漏,敬请指出。

Brief Introduction

Dynamic Tracing Static Tracing Counters
User space uprobes User Staticlly-Defined Tracing
Kernel space kprobes Kernel Tracepoint Events Software Events
Hardware CPU performance monitoring counters
Timed Profiling

笔者对原图稍作改动:用 Kernel Tracepoint Events 取代 Software Events ;这样做的理由是:Counters 在实际工作中较少应用,且 Software Events 和 Kernel Tracepoint Events 都在内核空间工作,容易搞混,所以在初识 perf 的过程中不妨先放下 Counters 。

表格中加粗部分是本篇文章着重探讨的 5 中 trace 方法。

另外,Timed Profiling 是一种非常特殊的 Counters ,它是从外部侵入的、基于采样的 Counters ,与 Software Events (内核自行计数)和 PMCs (硬件自行计数)都有所不同。

Timed Profiling

Timed Profiling 应该是大多数人对 perf 的第一印象:检查程序慢在何处。

1
2
3
4
5
6
7
8
9
10
11
12
13
14
// g++ -std=c++11 -O0 main.cpp -o main
#include <iostream>
void f() {
std::cout << "I'm in f." << std::endl;
}
void g() {
f();
std::cout << "I'm in g." << std::endl;
}
int main() {
for (int i = 0; i < 10000; i++) {
g();
}
}
1
2
3
sudo perf record --call-graph dwarf -F 99 ./main
sudo chmod 777 perf.data
perf script | ./FlameGraph/stackcollapse-perf.pl | ./FlameGraph/flamegraph.pl > out.svg

The choice of 99 Hertz, instead of 100 Hertz, is to avoid accidentally sampling in lockstep with some periodic activity, which would produce skewed results. This is also coarse: you may want to increase that to higher rates (eg, up to 997 Hertz) for finer resolution, especially if you are sampling short bursts of activity and you'd still like enough resolution to be useful. Bear in mind that higher frequencies means higher overhead.

采样频率尽量避免类似于 100 这样的整百数。

Kernel Tracepoint Events

Kernel Tracepoint Events 是内核事先埋好的点,结合 stack trace 能定位一些问题,如内存分配。

检查 Kernel Tracepoint Events 的命令:sudo perf list | awk -F: '/Tracepoint event/ { print $1 }' | sort | uniq

1
2
3
# sudo perf list | awk -F: '/Tracepoint event/ { print $1 }' | sort | uniq | grep "syscalls"
raw_syscalls
syscalls

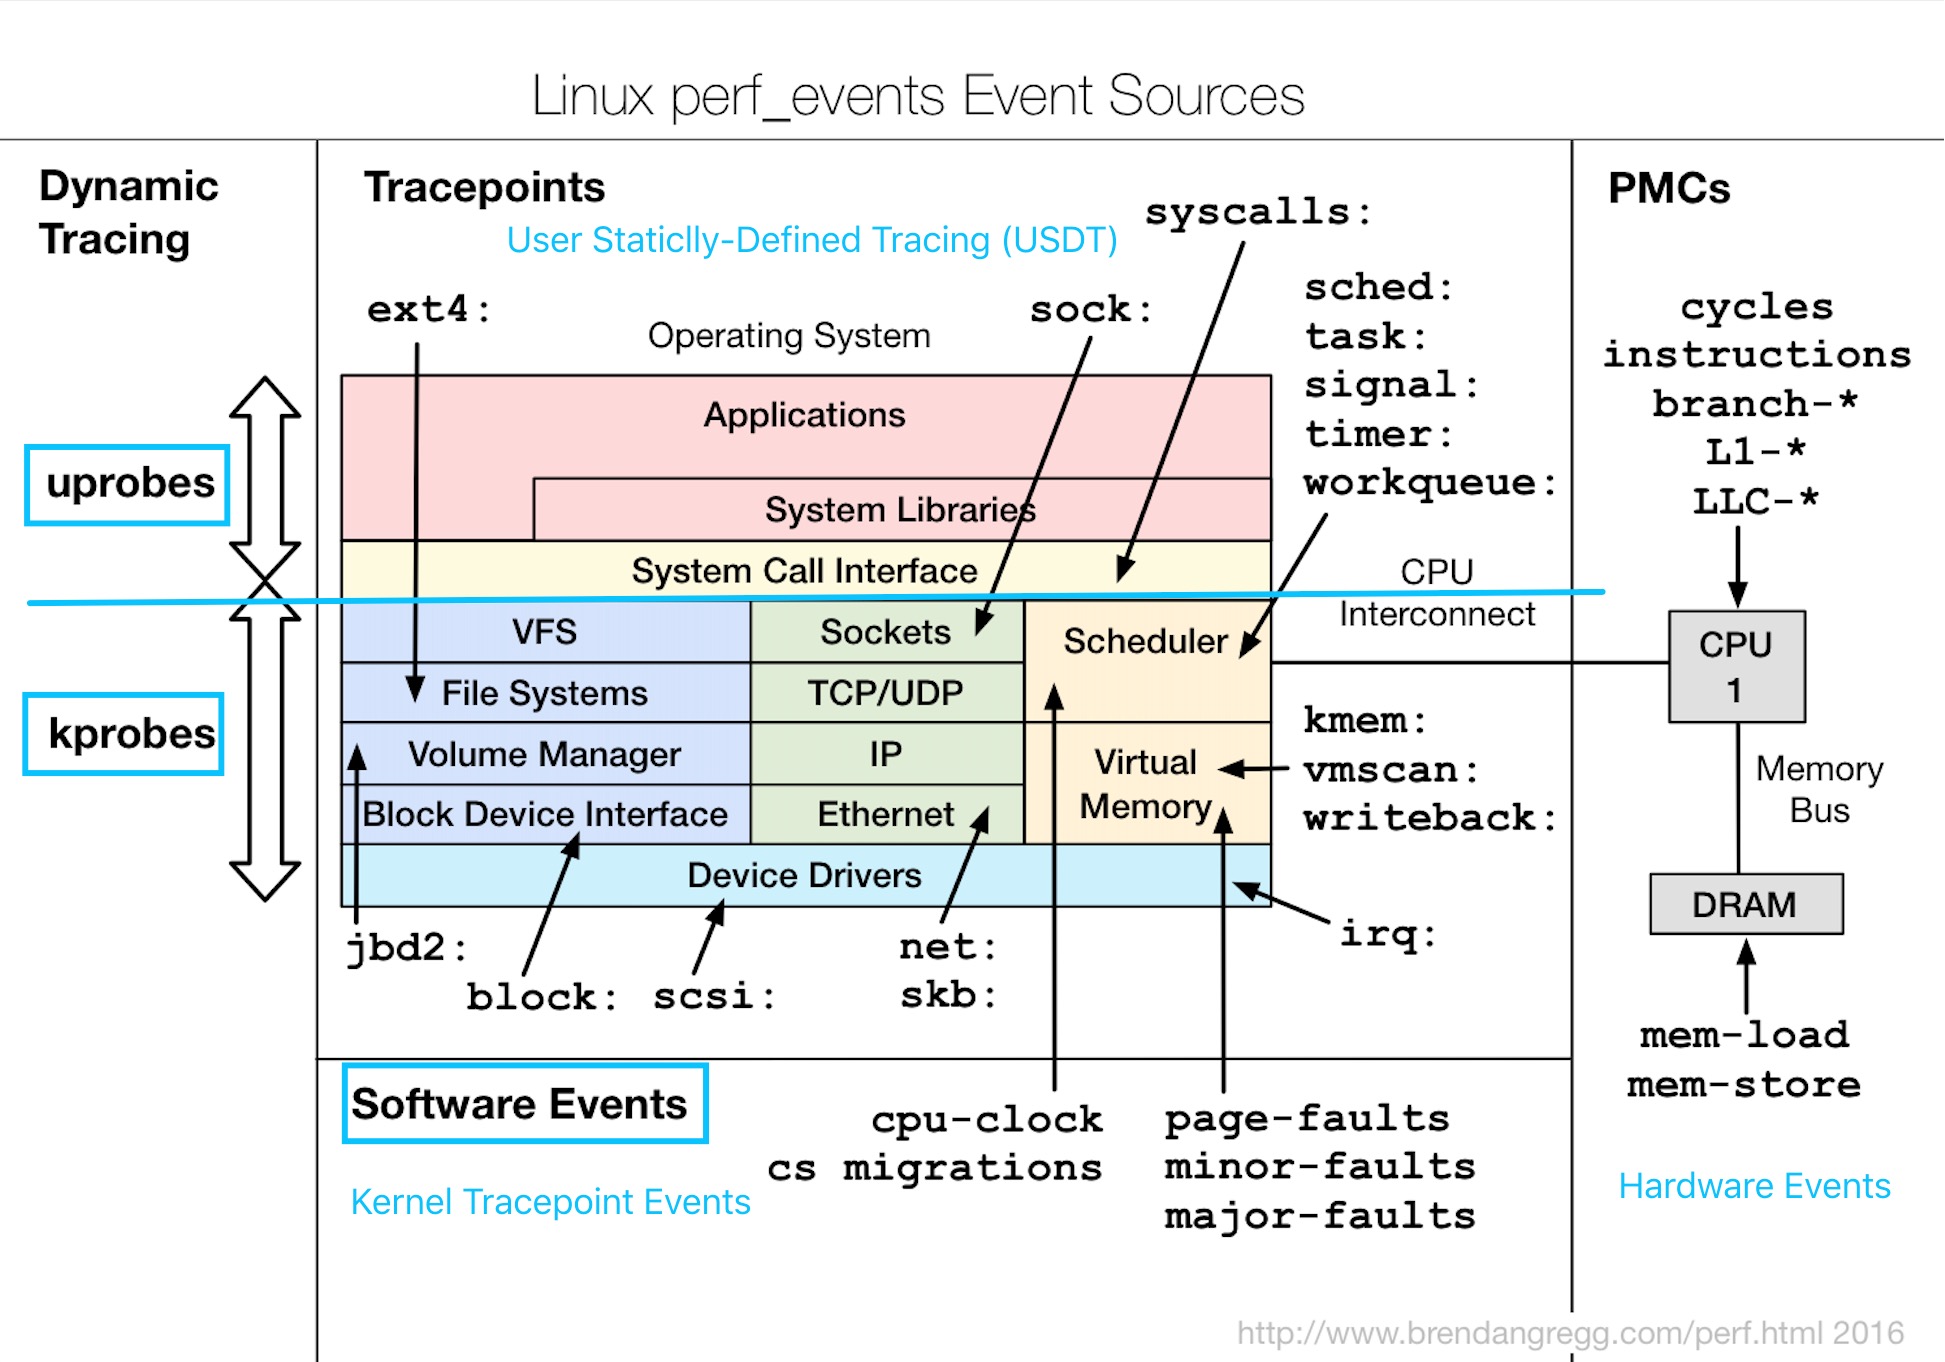
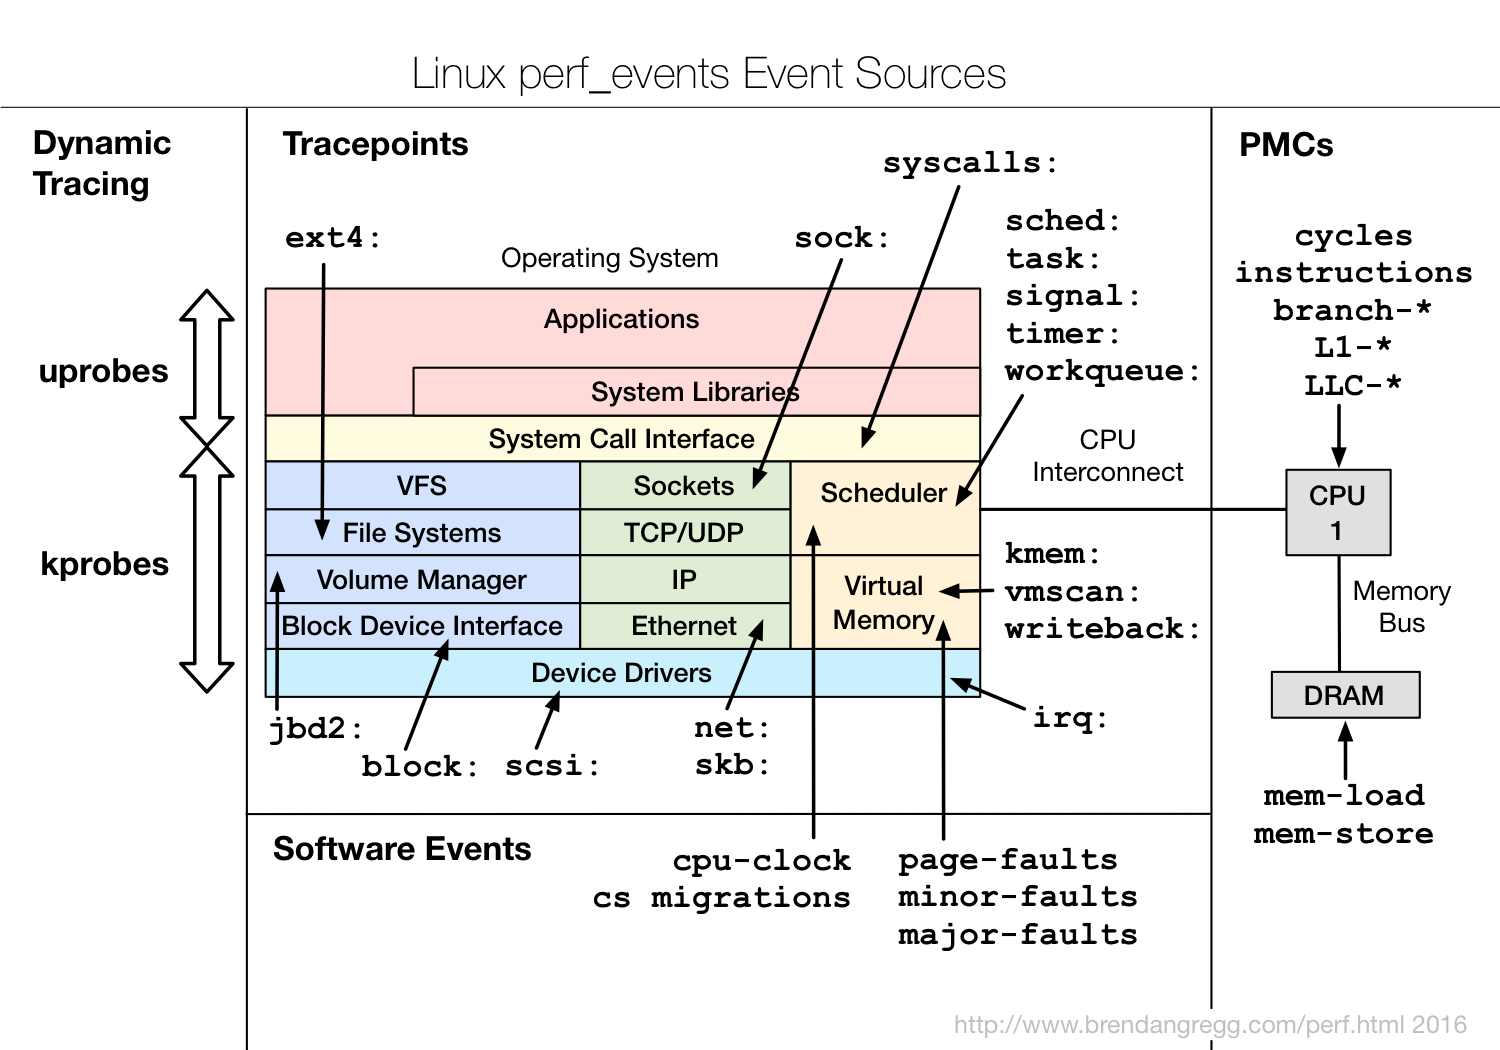
These are grouped into libraries of tracepoints; eg, "sock:" for socket events, "sched:" for CPU scheduler events. A key value of tracepoints is that they should have a stable API, so if you write tools that use them on one kernel version, they should work on later versions as well.

syscalls 也是一组事件。

Example

假设我们有一个因 mmap 导致虚存快速增长的程序,如何将泄漏点查出来呢?

1
2
3
4
5
6
7
// g++ -std=c++11 mmapButNotWritten.cpp -O3 -ggdb -o mmapButNotWritten
#include <sys/mman.h>
#include <iostream>
int main() {
auto p = mmap(nullptr, 8 * 1024, PROT_NONE, MAP_PRIVATE | MAP_ANONYMOUS, -1, 0);
std::cout << p << std::endl;
}
1
2
# sudo perf record --call-graph dwarf -e "syscalls:sys_exit_mmap" ./mmapButNotWritten
0x7f955b1b9000
1
2
3
4
5
6
7
8
# sudo chmod 777 perf.data
# perf script
# perf script 的一部分输出
mmapButNotWritt 31964 [000] 885228.328547: syscalls:sys_exit_mmap: 0x7f955b1b9000
7f955a935a13 mmap64 (inlined)
559554b957df main (/home/demons/mmapButNotWritten)
7f955a83bb96 __libc_start_main (/lib/x86_64-linux-gnu/libc-2.27.so)
559554b95859 _start (/home/demons/mmapButNotWritten)

perf 选项说明:

  • --call-graph: fp / dwarf / lbr / no

    fp 是 frame pointer 的缩写,使用 fp 要求编译时加上 -fno-omit-frame-pointer 选项

    dwarf 使用 libunwind 处理缺少 frame pointer 的情况

  • -e: events

  • -p: pid

进阶

如何获取 mmap 的参数和返回值?具体参见“ kprobes - Example 2 —— 打印参数”小节。

kprobes

根据文章如何获取内核配置,查看内核是否开启 kprobes 的命令为:

1
2
3
4
5
6
7
# sudo cat /boot/config-$(uname -r) | grep -i kprobe
CONFIG_KPROBES=y
CONFIG_KPROBES_ON_FTRACE=y
CONFIG_HAVE_KPROBES=y
CONFIG_HAVE_KPROBES_ON_FTRACE=y
CONFIG_KPROBE_EVENTS=y
# CONFIG_KPROBES_SANITY_TEST is not set

Example 1 —— 打印调用栈

借用“ Kernel Tracepoint Events - Example ”中的例子,应该如何用 kprobes 调查类似问题呢?

根据文章 connection between mmap user call to mmap kernal call ,mmap 最终会调用 mmap_region ,函数原型如下:

1
2
3
4
5
6
unsigned long mmap_region(struct file* file,
unsigned long addr,
unsigned long len,
unsigned long flags,
vm_flags_t vm_flags,
unsigned long pgoff);

通过 perf 添加 kprobes 的命令如下:

1
2
3
4
5
# sudo perf probe --add mmap_region
Added new event:
probe:mmap_region (on mmap_region)
# sudo perf list | grep mmap_region
probe:mmap_region [Tracepoint event]

添加的 kprobe 会在 /sys/kernel/debug/ 中显示出来:

1
2
3
4
# sudo cat /sys/kernel/debug/tracing/kprobe_events
p:probe/mmap_region _text+2238544
# sudo cat /sys/kernel/debug/kprobes/list
0000000044a2daff k mmap_region+0x0 [DISABLED][FTRACE]
1
2
3
4
5
6
7
8
9
10
11
12
13
14
15
# sudo perf record --call-graph dwarf -e probe:mmap_region ./mmapButNotWritten
0x7f1aedf48000
# sudo chmod 777 perf.data
# perf script
mmapButNotWritt 3547 [000] 951782.708116: probe:mmap_region: (ffffffffb5622850)
ffffffffb5622851 [unknown] ([kernel.kallsyms])
ffffffffb55feeac [unknown] ([kernel.kallsyms])
ffffffffb56209fa [unknown] ([kernel.kallsyms])
ffffffffb5433f6b [unknown] ([kernel.kallsyms])
ffffffffb5403bb3 [unknown] ([kernel.kallsyms])
ffffffffb5e00081 [unknown] ([kernel.kallsyms])
7f1aed6c4a13 mmap64 (inlined)
55f96b80b7df main (/home/demons/mmapButNotWritten)
7f1aed5cab96 __libc_start_main (/lib/x86_64-linux-gnu/libc-2.27.so)
55f96b80b859 _start (/home/demons/mmapButNotWritten)

通过 perf 删除 kprobe :

1
2
# sudo perf probe --del mmap_region
Removed event: probe:mmap_region

Example 2 —— 打印参数

笔者按照 DynamicTracingEg 的示例,要求 kprobe 打印 addr 参数:

1
2
3
# sudo perf probe --add 'mmap_region addr'
Failed to find the path for kernel: Invalid ELF file
Error: Failed to add events.

由于找不到 debug 信息,无法确认 addr 参数在函数调用中的位置(貌似?),直接指定 addr 参数报错。

指定参数名

根据知乎用户:基本无害的评论:

这一段 perf 找不到 kprobe 函数名外的参数、返回值信息是因为缺少 vmlinux ,可以使用命令 --vmlinux=<vmlinux_path> 指定 vmlinux 。发行版一般也会提供官方 kernel 对应的文件,比如 Debian/Ubuntu 下 linux-image-5.8.0-3-amd 包会有一个对应的 linux-image-5.8.0-3-amd-dbg 包,安装之后 perf probe 可以自动找到。安装后 perf probe -V printk 能列出参数。

依据 Stack Exchange: Where is vmlinux on my Ubuntu installation? 的指导安装 vmlinux :

1
2
3
4
5
# sudo apt-get install linux-image-4.19-amd64 linux-image-4.19-amd64-dbg
# uname -r
4.19.0-0.bpo.17-amd64
# ls /usr/lib/debug/boot/vmlinux-4.19.0-0.bpo.17-amd64
/usr/lib/debug/boot/vmlinux-4.19.0-0.bpo.17-amd64

4.9.0 版本的内核使用 kprobes 时会报错 mmap_region is out of .text, skip it. ,不建议使用。

1
2
3
4
5
6
7
8
9
10
11
12
13
14
15
16
17
18
# sudo perf probe -V mmap_region
Available variables at mmap_region
@<mmap_region+0>
char* __func__
long unsigned int addr
long unsigned int len
long unsigned int pgoff
struct file* file
vm_flags_t vm_flags
# sudo perf probe --add 'mmap_region addr'
Added new event:
probe:mmap_region (on mmap_region with addr)
You can now use it in all perf tools, such as:
perf record -e probe:mmap_region -aR sleep 1
# sudo perf record --call-graph dwarf -e probe:mmap_region ./mmapButNotWritten
0x7f8eb7a04000
[ perf record: Woken up 1 times to write data ]
[ perf record: Captured and wrote 0.217 MB perf.data (25 samples) ]
1
2
3
4
5
6
7
8
9
10
11
12
13
# sudo chmod 777 perf.data
# perf script
mmapButNotWritt 4032 [000] 2222.246366: probe:mmap_region: (ffffffffa5211e40) addr=0x555c53d86000
ffffffffa5211e41 mmap_region+0x1
ffffffffa52128bd do_mmap+0x46d
ffffffffa51ef312 vm_mmap_pgoff+0xd2
ffffffffa52cf1d8 elf_map+0x98
ffffffffa52d1121 load_elf_binary+0x661
ffffffffa5270f56 search_binary_handler+0xa6
ffffffffa5272a38 __do_execve_file.isra.34+0x578
ffffffffa5272e64 __x64_sys_execve+0x34
ffffffffa5004105 do_syscall_64+0x55
ffffffffa5800088 entry_SYSCALL_64_after_hwframe+0x44

删除 kprobe :

1
2
# sudo perf probe --del mmap_region
Removed event: probe:mmap_region

指定寄存器

我们可以根据 X86 calling conventions 手动指定参数:

Architecture Name Operation system, compiler Parameters (Registers) Parameters (Stack order)
x86-64 System V AMD64 ABI Solaris, Linux, BSD, OS X (GCC, Intel C++ Compiler) RDI, RSI, RDX, RCX, R8, R9, [XYZ]MM0–7 RTL (C)
1
2
3
4
5
6
unsigned long mmap_region(struct file* file,    // RDI
unsigned long addr, // RSI
unsigned long len, // RDX
unsigned long flags, // RCX
vm_flags_t vm_flags, // R8 vm_flags_t = unsigned long
unsigned long pgoff); // R9

在笔者机器上,perf 采用的寄存器名称都以 16-bit 寄存器名称为准,长度通过寄存器名称后的类型来指定。

X86 架构 寄存器对应表:

1
2
3
4
5
6
7
# sudo su
# echo 'p:mmap_region mmap_region file=%di:u64 addr=%si:u64 len=%dx:u64 flags=%cx:u64 vm_flags=%r8:u64 pgoff=%r9:u64' > /sys/kernel/debug/tracing/kprobe_events
# cat /sys/kernel/debug/tracing/kprobe_events
p:kprobes/mmap_region mmap_region file=%di:u64 addr=%si:u64 len=%dx:u64 flags=%cx:u64 vm_flags=%r8:u64 pgoff=%r9:u64
# exit
# sudo perf record --call-graph dwarf -e kprobes:mmap_region ./mmapButNotWritten
0x7f74dc178000
1
2
3
4
5
6
7
8
9
10
11
12
13
# sudo chmod 777 perf.data
# perf script
mmapButNotWritt 3781 [000] 967984.290594: kprobes:mmap_region: (ffffffffb5622850) file=0 addr=140139885461504 len=8192 flags=112 vm_flags=34213839224 pgoff=18446662055947353720
ffffffffb5622851 [unknown] ([kernel.kallsyms])
ffffffffb55feeac [unknown] ([kernel.kallsyms])
ffffffffb56209fa [unknown] ([kernel.kallsyms])
ffffffffb5433f6b [unknown] ([kernel.kallsyms])
ffffffffb5403bb3 [unknown] ([kernel.kallsyms])
ffffffffb5e00081 [unknown] ([kernel.kallsyms])
7f74db8f4a13 mmap64 (inlined)
5593b07117df main (/home/demons/mmapButNotWritten)
7f74db7fab96 __libc_start_main (/lib/x86_64-linux-gnu/libc-2.27.so)
5593b0711859 _start (/home/demons/mmapButNotWritten)

删除 kprobe :

1
2
3
# sudo su
# echo > /sys/kernel/debug/tracing/kprobe_events
# exit

kprobes 可以分为两类:普通 kprobes 和 return kprobes 。普通 kprobes 以 p 开头, 在函数执行之前调用,因而可以获取到参数;return kprobes 以 r 开头,在函数执行之后调用,因而不能获取到参数。

User Statically-Defined Tracing

USDT 是用户代码事先埋好的点,以下实验需要先安装 systemtap-sdt-dev 。

Support was added in later 4.x series kernels.

埋点

1
2
3
4
5
6
#include <sys/sdt.h>
// g++ -std=c++11 -shared -fPIC -O3 -ggdb math.cpp -o libmath.so
int funcInLib(int x, int y) {
DTRACE_PROBE2(math, funcInLib, x, y);
return x + y;
}
1
2
3
4
// dtrace -G -64 -s math.d libmath.so
provider math {
probe funcInLib(int, int);
}
1
2
3
4
5
6
7
8
9
10
11
12
13
# readelf -n libmath.so
Displaying notes found in: .note.gnu.build-id
Owner Data size Description
GNU 0x00000014 NT_GNU_BUILD_ID (unique build ID bitstring)
Build ID: e40dccf6baa20b96206670d5a52b770f5df98608

Displaying notes found in: .note.stapsdt
Owner Data size Description
stapsdt 0x00000037 NT_STAPSDT (SystemTap probe descriptors)
Provider: math
Name: funcInLib
Location: 0x0000000000000580, Base: 0x0000000000000591, Semaphore: 0x0000000000000000
Arguments: -4@%edi -4@%esi

监听

1
2
3
4
5
6
7
8
9
# sudo perf buildid-cache --add libmath.so
# sudo perf list | grep sdt_math
sdt_math:funcInLib [SDT event]
# sudo perf probe sdt_math:funcInLib
Added new event:
sdt_math:funcInLib (on %funcInLib in /home/demons/uprobe/libmath.so)
# sudo perf list | grep sdt_math
sdt_math:funcInLib [Tracepoint event]
sdt_math:funcInLib [SDT event]
1
2
3
4
5
6
7
8
# sudo perf record --call-graph dwarf -e sdt_math:funcInLib ./main
# sudo chmod 777 perf.data
# perf script
main 4146 [000] 970663.914768: sdt_math:funcInLib: (7f7ef2391580) arg1=1 arg2=2
7f7ef2391580 funcInLib (/home/demons/uprobe/libmath.so)
55e4d885b632 main (/home/demons/uprobe/main)
7f7ef1fc1b96 __libc_start_main (/lib/x86_64-linux-gnu/libc-2.27.so)
55e4d885b669 _start (/home/demons/uprobe/main)
1
2
3
# sudo perf probe --del sdt_math:funcInLib
Removed event: sdt_math:funcInLib
# sudo perf buildid-cache --remove libmath.so

uprobes

根据文章如何获取内核参数,查看内核是否开启 uprobes 的命令:

1
2
3
4
// sudo cat /boot/config-$(uname -r) | grep -i uprobe
CONFIG_ARCH_SUPPORTS_UPROBES=y
CONFIG_UPROBES=y
CONFIG_UPROBE_EVENTS=y
1
2
3
4
// g++ -std=c++11 -shared -fPIC -O3 -ggdb math.cpp -o libmath.so
int funcInLib(int x, int y) {
return x + y;
}
1
2
3
4
5
// g++ -std=c++11 -O3 -ggdb main.cpp -L$PWD -lmath -Wl,-rpath=$PWD -o main
int funcInLib(int x, int y);
int main() {
funcInLib(1, 2);
}

Example 1 —— 通过 perf 插入 uprobes

1
2
3
4
# sudo perf probe -x libmath.so '--add=funcInLib x y'
Probe on address 0x580 to force probing at the function entry.
Added new event:
probe_libmath:funcInLib (on funcInLib in /home/demons/uprobe/libmath.so with x y)

Linux 3.13.1 kernel 可以使用以下命令创建 uprobes :

1
# sudo perf probe -x libmath.so '--add=funcInLib x=%di:s32 y=%si:s32'
1
2
3
4
5
6
7
8
# sudo perf record --call-graph dwarf -e probe_libmath:funcInLib ./main
# sudo chmod 777 perf.data
# perf script
main 3998 [000] 969778.093408: probe_libmath:funcInLib: (7f1ed04b2580) x=1 y=2
7f1ed04b2580 funcInLib (/home/demons/uprobe/libmath.so)
559fa97b6632 main (/home/demons/uprobe/main)
7f1ed00e2b96 __libc_start_main (/lib/x86_64-linux-gnu/libc-2.27.so)
559fa97b6669 _start (/home/demons/uprobe/main)
1
2
# sudo perf probe -x libmath.so --del funcInLib
Removed event: probe_libmath:funcInLib

Example 2 —— 原始 uprobes

本小节参考 uprobe 文档

根据 find functions start offset in elf ,函数相对于 ELF 文件的偏移量为:

function symbol offset = function symbol visual address - .text virtual address + .text offset

1
2
3
4
5
6
7
8
9
# readelf -S libmath.so
Section Headers:
[Nr] Name Type Address Offset
Size EntSize Flags Link Info Align
[ 9] .text PROGBITS 00000000000004a0 000004a0
00000000000000e5 0000000000000000 AX 0 0 16
# readelf -s libmath.so | grep funcInLib
9: 0000000000000580 5 FUNC GLOBAL DEFAULT 9 _Z9funcInLibii
54: 0000000000000580 5 FUNC GLOBAL DEFAULT 9 _Z9funcInLibii

funcInLib offset = 0x580 - 0x4a0 + 0x4a0 = 0x580

1
2
3
4
5
# sudo su
# echo 'p:funcInLib /home/demons/uprobe/libmath.so:0x580 x=%di:s32 y=%si:s32' > /sys/kernel/debug/tracing/uprobe_events
# cat /sys/kernel/debug/tracing/uprobe_events
p:uprobes/funcInLib /home/demons/uprobe/libmath.so:0x0000000000000580 x=%di:s32 y=%si:s32
# exit
1
2
3
4
5
6
7
8
9
10
# sudo perf list | grep funcInLib
uprobes:funcInLib [Tracepoint event]
# sudo perf record --call-graph dwarf -e uprobes:funcInLib ./main
# sudo chmod 777 perf.data
# perf script
main 3939 [000] 969570.321259: uprobes:funcInLib: (7ff377544580) x=1 y=2
7ff377544580 funcInLib (/home/demons/uprobe/libmath.so)
562707b8b632 main (/home/demons/uprobe/main)
7ff377174b96 __libc_start_main (/lib/x86_64-linux-gnu/libc-2.27.so)
562707b8b669 _start (/home/demons/uprobe/main)
1
2
3
# sudo su
# echo > /sys/kernel/debug/tracing/uprobe_events
# exit

Software Events

Software events may have a default period. This means that when you use them for sampling, you're sampling a subset of events, not tracing every event. You can check with perf record -vv:

1
2
3
4
# perf record -vv -e context-switches /bin/true
perf_event_attr:
{ sample_period, sample_freq } 4000
freq 1

This default means is that the kernel adjusts the rate of sampling so that it's capturing about 4,000 context switch events per second. If you really meant to record them all, use -c 1:

1
2
3
# perf record -vv -e context-switches -c 1 /bin/true
perf_event_attr:
{ sample_period, sample_freq } 1

Many other events (like tracepoints) have a default of 1 anyway. You'll encounter a non-1 default for many software and hardware events.

Reference

perf Examples

obtain kernel config

kprobe documentation

uprobe documentation

Statically Defined Tracing for User Applications

X86 Architecture

Calling Conventions

知乎用户:基本无害的评论

Stack Exchange: Where is vmlinux on my Ubuntu installation?


Perf Without Programming
https://clcanny.github.io/2020/06/19/computer-science/performance-analysis/perf-without-programming/
作者
JunBin
发布于
2020年6月19日
许可协议