背景
程序链接 TCMalloc ,同时调用 mmap / munmap 管理一部分较大的内存;通过分析 TCMalloc 的统计信息,判断内存泄漏不是由 new / malloc 等常规接口导致的;因此怀疑是 mmap 导致的内存泄漏。
通过 Hook mmap / munmap 记录下每一次调用,可以分析出是哪里导致的内存泄漏。
如何存储调用信息?
这涉及到三个问题的回答:
buffer 是 thread local 还是 global ?
如何处理 buffer 满的情况?
什么时候将 buffer 写出?
thread local / global
thread local 的优势是不需要任何同步手段,劣势是时序关系无法保证。
内存的分配与释放未必是同一个线程,如果多线程之间 mmap / munmap 的时序关系没有记录下来,后期很难恢复,也很难知道是哪个线程导致的泄漏。
global buffer 的劣势是需要同步手段,同步手段可以选择比锁轻量的原子变量。
1 2 3 4 5 uint64_t index = mEndIndex.fetch_add (2 , std::memory_order_relaxed);GenFirstValue (Type::eMunmap, cycle, p);1 ] = GenSecondValue (isSucceed, munmapSize);
一旦将写入位置定下来,不同线程的写入并不会发生冲突。
注意 fetch_add 用最松的 memory order 来保证性能受到最低限度的影响。
如何处理 buffer 满的情况?
三种处理手段:不写入、扔掉前面的信息、等待 buffer 刷新。
等待 buffer 刷新不可避免地引入 PV 等同步手段(生产者、消费者模型),这会导致性能受到的影响不可控。
不写入和扔掉前面的信息本质上是同一种处理手段,在无法判断信息重要性的前提下,两者任意选一种皆可。
最终选择扔掉前面的信息,理由如下:
扔掉前面的信息实现简单;
如果待调查的问题是内存暴涨,那么越新的信息越重要。
如果发生信息覆盖,需要留下标记,方便分析(至少可以提示用户)。
引入长度为 2 bits 的 cycle 字段,cycle = the lowest 2 bits of (index / buffer size) 。
1 *cycle = (index / mBufferSize) & 0x3 ;
将 cycle 字段写出到 buffer ,当分析程序看到 cycle 变化较快的时候,就知道出现了信息丢弃的情况。
什么时候将 buffer 写出?
buffer 满的时候异步写出;
buffer 满的时候同步写出;
另起一个线程写出。
以 buffer 满作为写出条件会导致一个问题:如何处理 buffer 未满的情况?如果一个程序 mmap / munmap 的次数较少,记录不足以写满 buffer ,那么 buffer 只能在进程结束的时候通过全局变量的析构函数一次性写出。但不是所有的程序都是 gracefully shutdown 的,特别是某些因为内存超限被 OOM Killer 杀掉的程序,这些程序的析构函数未必有机会得到调用。
异步写出有两个问题:
与写入 buffer 有竞争关系,可能导致数据混乱;
为了 hook mmap / munmap ,我们的动态链接库加载时机非常早,此时 libpthread.so 还没有加载进来,因而不能直接调用 std::thread 和 pthread_create 函数。
1
2
3
4
5
6
7
8
9
10
11
12
13
14
15
16
mPThreadLib = dlopen ("libpthread.so" , RTLD_LAZY | RTLD_LOCAL);using FuncType = void * (*)(void *);using PThreadCreateType =int (*)(pthread_t *, pthread_attr_t *, FuncType, void *);auto pthreadCreate = reinterpret_cast <PThreadCreateType>(dlsym (mPThreadLib, "pthread_create" ));auto pf = &RingedBuffer::Dump;pthreadCreate (nullptr , *reinterpret_cast <FuncType*>(&pf), this );using PThreadJoinType = int (*)(pthread_t , void **);auto pthreadJoin = reinterpret_cast <PThreadJoinType>(dlsym (mPThreadLib, "pthread_join" ));void * ret = nullptr ;pthreadJoin (mDumpThread, &ret);
全局对象初始化顺序
我们有一个全局变量 RingedBuffer sRingedBuffer 负责记录调用信息,我们能否依赖构造函数将其成员变量初始化?
要注意:mmap / munmap 并不是只有 main 函数才会调用,TCMalloc / pthread 都会调用这两个函数。
即使我们的动态链接库先于这两个库加载,也没有办法保证 sRingedBuffer 的构造函数先于 TCMalloc / pthread 的全局变量调用。
因此,需要在每一次记录之前都调用一下 Init 函数。
1
2
3
4
void RecordMmap (void * p, int mmapSize, char ** funcNames, int funcNamesSize) Init ();
TCMalloc 中也采用了相同的做法:
1
2
3
void * do_memalign (size_t align, size_t size) if (Static::pageheap () == NULL ) ThreadCache::InitModule ();
如何获取调用栈?
libunwind 提供的 backtrace 函数;
glibc 指代的 backtrace 函数;
获取 rsp / rbp 手动遍历;
__builtin_frame_address 。
第 3 种和第 4 种方法都会在开优化编译过的程序上面临 coredump 风险,因为栈底指针的压栈不再是必须的。
1
2
3
uint64_t * rbp;asm ("mov %%rbp,%0" : "=r" (rbp));auto ra = *(rbp + 1 );
以上代码在遍历深度不为 1 的栈时会碰到 coredump 问题。
libunwind 能帮我们处理掉这些 tricky 的角落,用 libunwind 是不错的选择。
libunwind 的一些函数使用了不可重入锁,并且关了终端,所以不做特殊处理的话,会看到程序无法用 Ctrl-C 杀死,只能用 kill -9 结束。
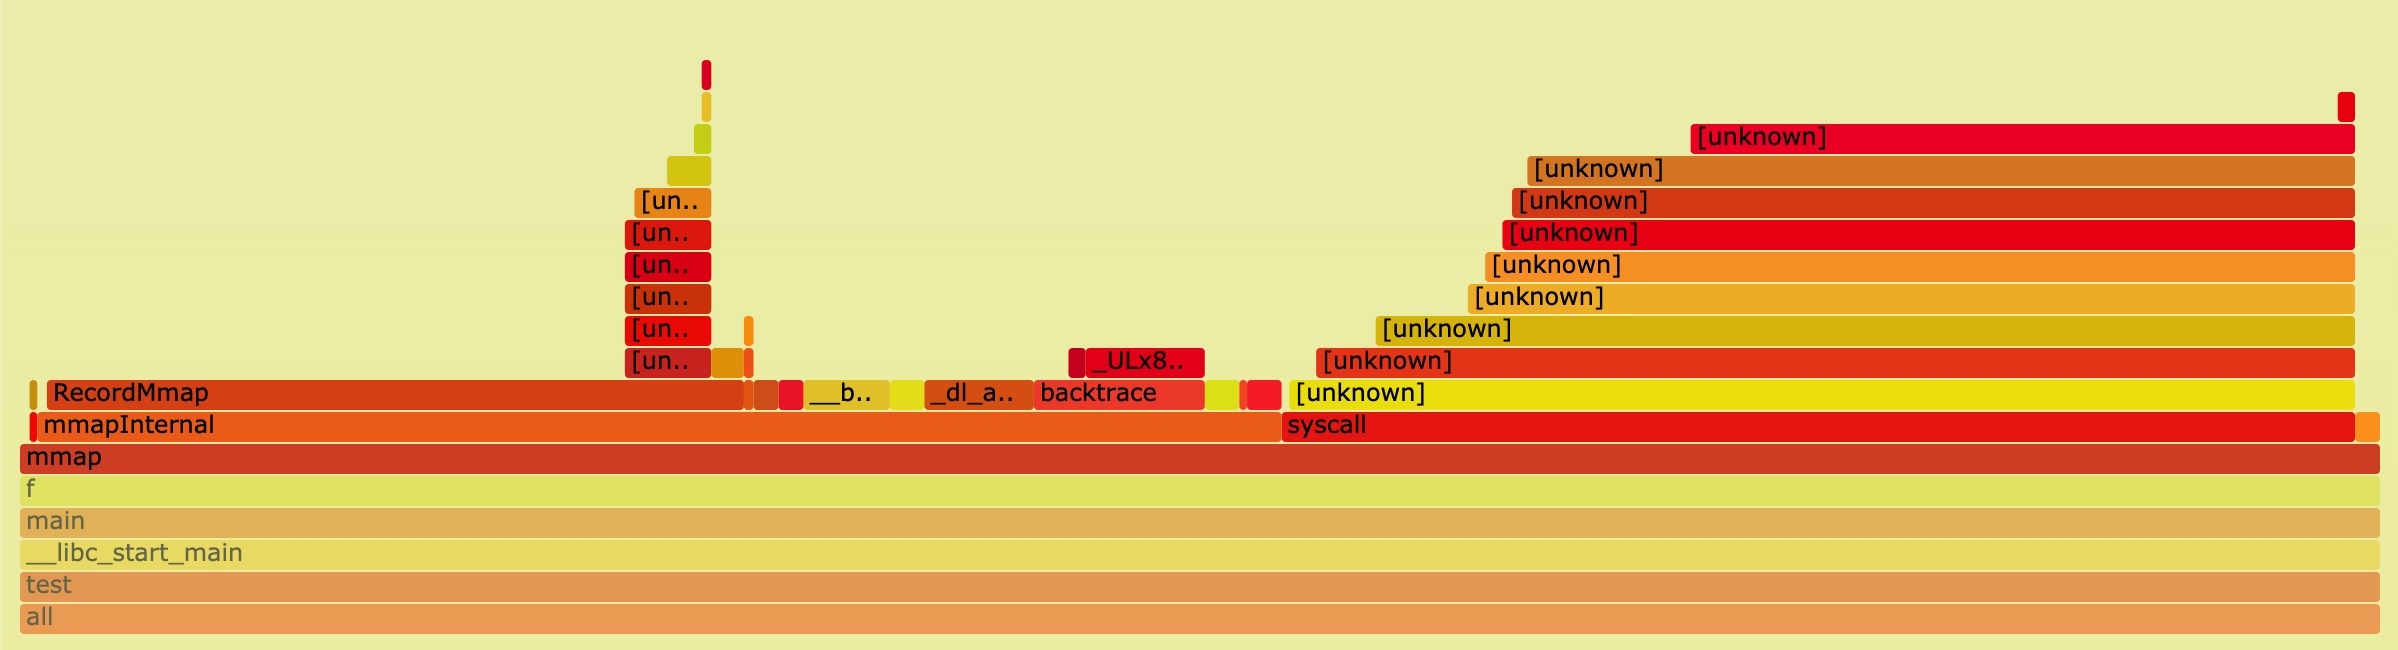
1
2
3
4
5
6
7
8
9
10
11
12
13
14
15
16
17
18
19
0 0x00007f7e5119653d in __lll_lock_wait ()1 0x00007f7e51191e1b in _L_lock_883 ()2 0x00007f7e51191ce8 in pthread_mutex_lock () 3 0x00007f7e513a8aca in ?? () 4 0x00007f7e513a91f9 in ?? () 5 0x00007f7e513ab206 in _ULx86_64_step () 6 0x00007f7e513a6576 in backtrace () 7 0x00007f7e5182fc9f in mmap (addr=0x0 , length=4096 , prot=3 , flags=34 , fd=-1 , offset=0 ) 8 0x00007f7e513a937d in ?? () 9 0x00007f7e513a9c5b in ?? () 10 0x00007f7e506d749c in dl_iterate_phdr () 11 0x00007f7e513aa23e in ?? () 12 0x00007f7e513a7c2d in ?? () 13 0x00007f7e513a8d72 in ?? () 14 0x00007f7e513a91f9 in ?? () 15 0x00007f7e513ab206 in _ULx86_64_step () 16 0x00007f7e513a6576 in backtrace () 17 0x00007f7e5182fc9f in mmap (addr=0x0 , length=4096 , prot=3 , flags=34 , fd=-1 , offset=0 ) 18 0x00000000004011dd in main ()
可以看到:
libunwind 将 glibc 提供的 backtrace 换成了自己的实现;
_ULx86_64_step 会调用 mmap 函数。
为了避免死锁,我们要用一个 thread local 变量记录 libunwind 提供的函数 是否已经被调用了。
1 2 3 4 5 6 7 8 9 10 11 12 13 14 15 16 17 18 19 20 21 int _ULx86_64_init_local(unw_cursor_t * cursor, unw_context_t * context) {Init ();true ;auto r = Initializer::sUnwInitLocal (cursor, context);false ;return r;int _ULx86_64_step(unw_cursor_t * cursor) {Init ();true ;auto r = Initializer::sUnwStep (cursor);false ;return r;
仅仅 hook 这两个函数是不够的,因为 libunwind 提供的 backtrace 函数在编译时可以找到 _ULx86_64_init_local 和 _ULx86_64_step 函数,不会动态绑定这两个函数;所以需要 hook backtrace 函数:
1
2
3
4
5
6
7
8
9
10
11
12
13
14
15
16
17
18
19
20
21
22
23
24
25
26
27
28
29
int backtrace (void ** returnAddrs, int skipCount, int maxDepth) void * ip = nullptr ;unw_cursor_t cursor;unw_context_t uc;unw_getcontext (&uc);int ret = unw_init_local (&cursor, &uc);assert (ret >= 0 );for (int i = 0 ; i < skipCount + 1 ; i++) {if (unw_step (&cursor) <= 0 ) {return 0 ;int n = 0 ;while (n < maxDepth) {if (unw_get_reg (reinterpret_cast <unw_word_t *>(&ip)) < 0 ) {break ;if (unw_step (&cursor) <= 0 ) {break ;return n;
backtrace 函数的实现可以借鉴 TCMalloc 的 GET_STACK_TRACE_OR_FRAMES 函数。
如何将返回地址解释成符号?
这里要做一个选择:原地解释还是事后解释?
事后解释性能好;
如果不考虑 dlopen 和 dlclose ,每一次进程启动,ELF 文件加载到虚拟内存的位置是固定的;
如果程序反复调用 dlopen 和 dlclose ,部分 ELF 文件在虚拟内存中的位置是不可知的;
addr2line 2.27 有 bug ,解释结果可能和 gdb 不一致。
所以这个版本用了原地解释的方案。
1
2
3
4
5
void * returnAddrs[10 ];int n = backtrace (reinterpret_cast <void **>(&returnAddrs), 1 , 10 );char ** funcNames = backtrace_symbols (returnAddrs, n);free (funcNames);
boost 用了一种更加折中的方案:开一个子进程来解释(这在理论上也会有 gap )。
事后解释具有实现的可能性:RTLD-AUDIT 能够审计动态链接库的加载与卸载,这会放在下一篇文章讲。
性能分析
单线程下的火焰图(编译时未开优化)。
RecordMmap 在单线程下的表项并不算优异,主要是字符串拷贝等操作耗时。
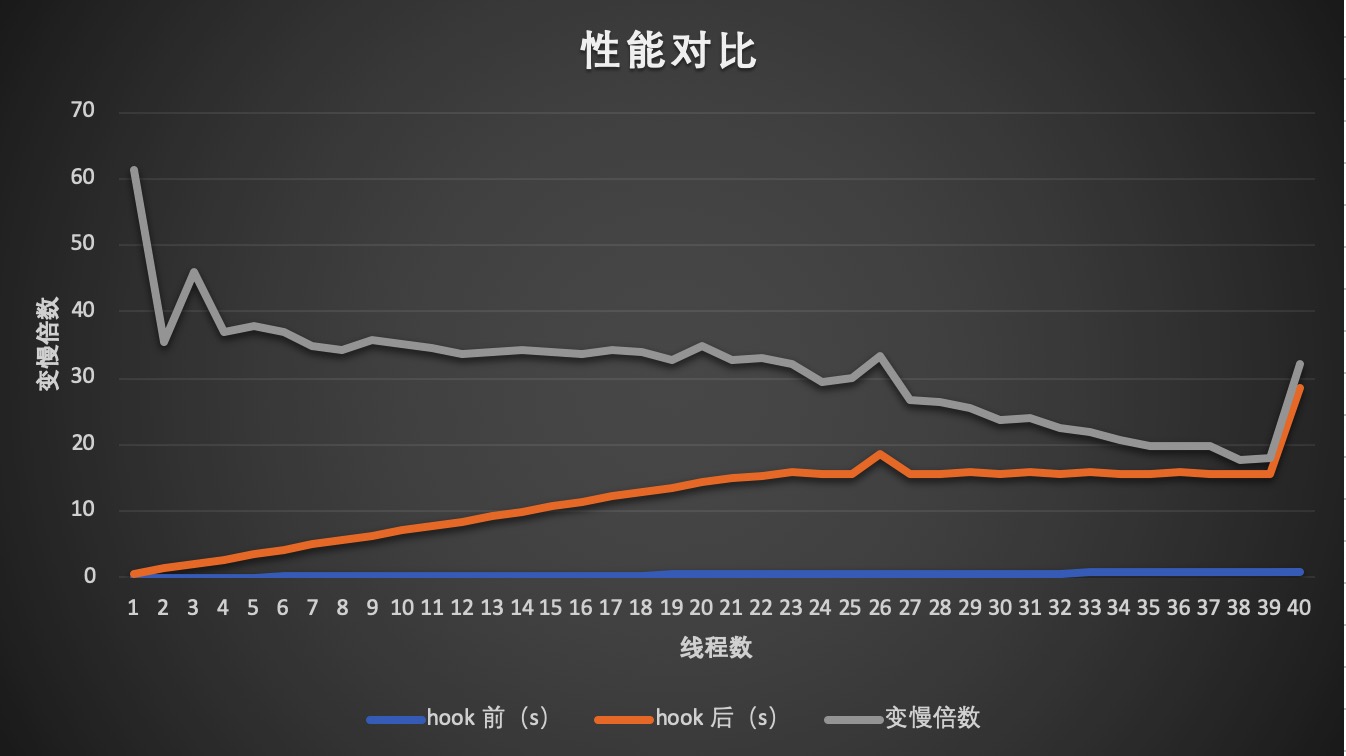
每个线程分别调用 10000 次 mmap 和 munmap ,可以看到:
hook 后 mmap / munmap 的耗时大概是 hook 前的 35 倍;
hook 后变慢程度并没有随着线程的增长而增长。
1
2
3
4
g++ -std=c++11 mmap.cpp ringed_buffer.cpp -ltcmalloc -lunwind -lpthread -ldl -O3 -ggdb -shared -fPIC -o libmmap_analyser.sotest env LD_PRELOAD="libmmap_analyser.so" test